- Return to book
- Review this book
- About the author
- Introduction
- 1. Local Delicacies Project
- 2. List Views & Adapters
- 3. Navigation
- 4. Networking
- 5. Data Persistence
- 6. More Layouts & Views
- 7. Multi-factor Support
- 8. Performance
- 9. Services
- 10. Resources
- 11. Epilogue
- 12. About The Author
- 13. Bibliography
Lab: Memory Analysis
Android Tools
DDMS is your friend and will help you with many performance tuning tasks. You can also use tracing tools to help in your quest.
Heap Allocations + Garbage Collection
Let's look at our memory usage. We'll use Android's memory management guide to analyze how we're managing memory in our application.
Start by searching logcat for dalvikvm and filtering by your process id (in this case, 1369, which is shown in parenthesis).
Here's a snippet from the startup of my application:
08-01 11:15:54.663: DEBUG/dalvikvm(1369): GC_FOR_ALLOC freed 1515K, 23% free 5738K/7384K, paused 4ms, total 4ms
08-01 11:15:54.663: INFO/dalvikvm-heap(1369): Grow heap (frag case) to 8.735MB for 3153932-byte allocation
08-01 11:15:54.667: DEBUG/dalvikvm(1369): GC_CONCURRENT freed 10K, 16% free 8808K/10468K, paused 2ms+0ms, total 5ms
08-01 11:15:54.707: DEBUG/dalvikvm(1369): GC_FOR_ALLOC freed <1K, 16% free 8808K/10468K, paused 2ms, total 2ms
08-01 11:15:54.735: INFO/dalvikvm-heap(1369): Grow heap (frag case) to 35.795MB for 28385292-byte allocation
08-01 11:15:54.743: DEBUG/dalvikvm(1369): GC_CONCURRENT freed 0K, 5% free 36528K/38192K, paused 2ms+1ms, total 5ms
08-01 11:15:54.939: DEBUG/dalvikvm(1369): GC_FOR_ALLOC freed 1084K, 12% free 16193K/18208K, paused 2ms, total 2ms
08-01 11:15:58.883: DEBUG/LocationListDBHelper(1369): Read all locations. Count = 3
...
I noticed that there were lots of small garbage collections and there was a message about the app perhaps doing too much on the main thread. I also have only a small percentage of the heap available to me.
08-01 11:16:05.707: INFO/Choreographer(1369): Skipped 395 frames!  The application may be doing too much work on its main thread.
08-01 11:15:54.743: DEBUG/dalvikvm(1369): GC_CONCURRENT freed 0K, 5% free 36528K/38192K, paused 2ms+1ms, total 5ms
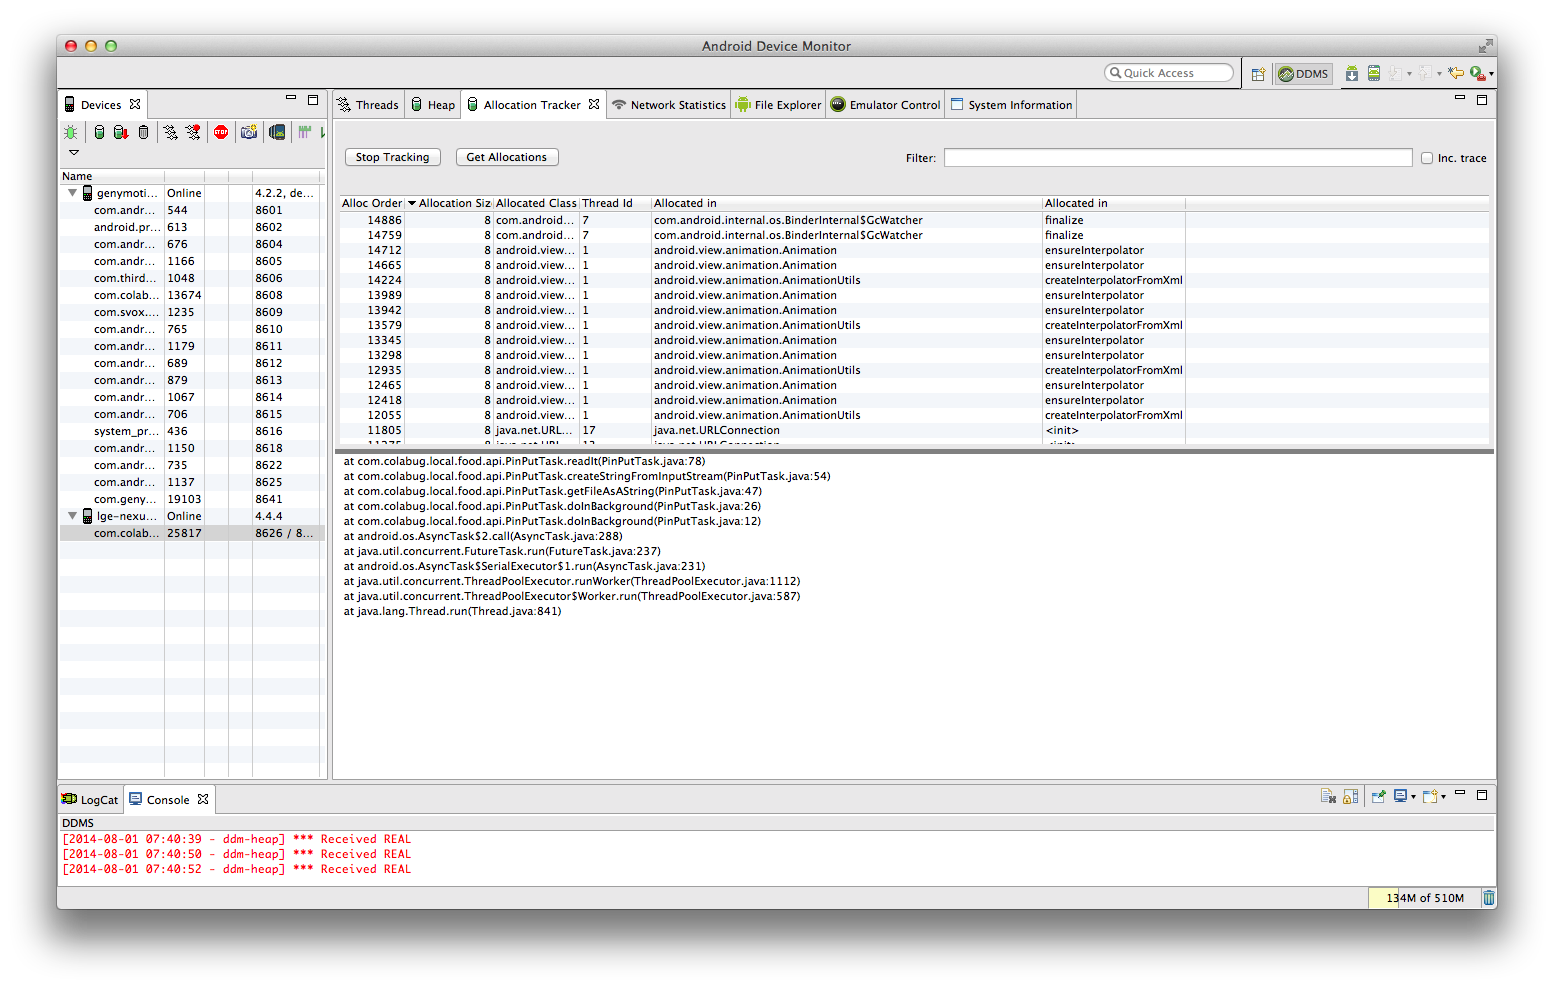
Use this information and the ddms tool to get an idea for what operations are slow in your application and causing heap allocations and garbage collections.

When reviewing the infromation here I noticed there were many bitmap allocations (expected) and lots of small allocations. There were calls to the DB, to the download AsyncTask, and constructing the views for the list.
The next step is to check
adb shell dumpsys meminfo <package_name>
Applications Memory Usage (kB):
Uptime: 2372497 Realtime: 2372497

** MEMINFO in pid 13674 [com.colabug.local.food] **
                         Shared  Private     Heap     Heap     Heap
                   Pss    Dirty    Dirty     Size    Alloc     Free
                ------   ------   ------   ------   ------   ------
       Native     1591      804     1548     6776     6738       37
       Dalvik    42908     5044    42632    45176    42570     2606
       Cursor        0        0        0
       Ashmem        0        0        0
    Other dev        4       24        0
     .so mmap     1194     1992      196
    .jar mmap        0        0        0
    .apk mmap      141        0        0
    .ttf mmap        9        0        0
    .dex mmap     1542        0        0
   Other mmap      157       24      140
      Unknown      380       12      380
        TOTAL    47926     7900    44896    51952    49308     2643

 Objects
               Views:       67         ViewRootImpl:        1
         AppContexts:        3           Activities:        1
              Assets:        2        AssetManagers:        2
       Local Binders:       10        Proxy Binders:       19
    Death Recipients:        0
     OpenSSL Sockets:        0

 SQL
         MEMORY_USED:       89
  PAGECACHE_OVERFLOW:       16          MALLOC_SIZE:       62


 Asset Allocations
    zip:/data/app/com.colabug.local.food-2.apk:/resources.arsc: 6K